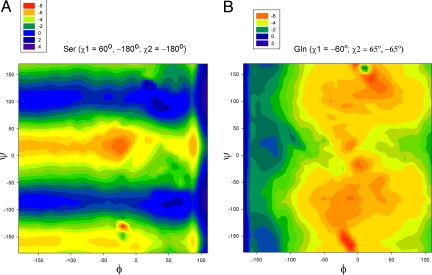
Fig. 2.
Map of the differences in the computed 13Cα chemical shifts (in ppm according to the color scale) between an arbitrarily selected pair of side-chain torsional angles. The color indicates the difference in 13Cα chemical shifts (in ppm) for any pair of φ and ψ. (A) for Ser with χ1 = 160° and −180°, and a fixed χ2 = −180°; and panel (B) for Gln with χ2 = 65° and −65°, and a fixed χ1 = −60°.

