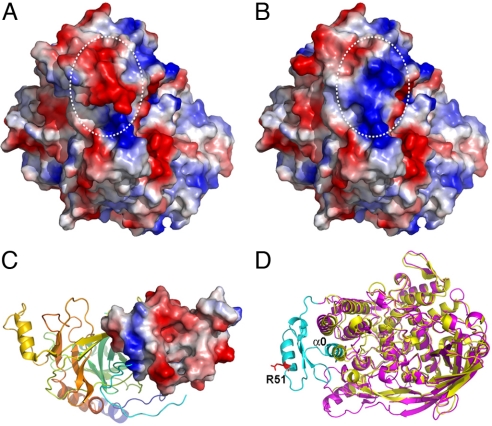
Fig. 4.
Electrostatic surface potential switching of M. sexta PPO2 on cleavage. The negatively and positively charged surfaces are colored in red and blue, respectively. (A) The intact PPO2 structure. (B) Computer-modeled PPO2 structure after simulated cleavage at R51 and removal of the α-helix where it locates. Notice the oppositely charged surface after cleavage as indicated in white circles. (C) Crystal structure of an SPH from H. diomphalia (PDB ID code 2B9L). The clip domain is shown as an electropotential surface, whereas the rest of the protein is shown in the ribbon. Notice the predominantly negative-charged surface of the clip domain. (D) Superimposition of the structures of PPO2 (purple) and Lp-HC (PDB ID code 1OXY, yellow). The N-terminus of PPO2 flanking the proteolytic site R51 (shown in the red stick) is colored in cyan. Notice that α0 (1–16) of PPO2 superimposes well with one of the conserved α-helices in domain I of Lp-HC. Therefore, α0 is considered as part of domain I in PPO2, which may still be associated with the rest of the PO structure even after the proteolytic cleavage.

