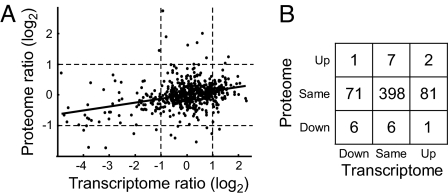
Fig. 4.
Protein versus mRNA ratios. (A) Mean ratios are plotted for each protein as a function of mean mRNA ratio, with the best-fit line determined by linear regression. (B) Bootstrap analysis of Pearson product moment correlation coefficients among pairs of microarray and proteomics replicates suggests a correlation of only 0.33 (asymmetric 95% confidence interval: 0.05–0.37). The Spearman rank correlation coefficient also was 0.33. Dotted lines indicate 2-fold changes in expression; these thresholds were used to classify protein and mRNA ratio measurements qualitatively as increased (“up”), decreased (“down”), or unchanged (“same”) in B. The correlation between mRNA and protein ratios is limited, and most agreement is among the species showing no significant change at either protein or mRNA levels.

