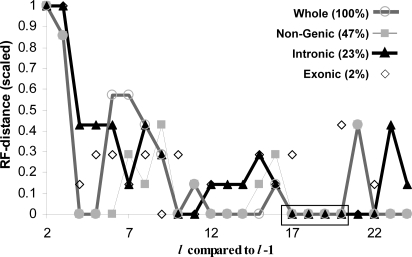
Fig. 3.
Tree-topology convergence. The tree generated with features of length l is compared with the tree from l−1 by using the RF distance. Largest genome partitions are indicated by lines. The topologies tend to converge (RF = 0) for the largest genome fractions (whole, nongenic, and intronic) in the range from l = 16–21. This convergence range is indicated by the boxed region. The topologies are identical for all fractions for l = 17–19. Percentage values indicate the average fraction of the whole genome represented by each partition. The remaining 28% represents genic regions that are neither introns nor exons.

