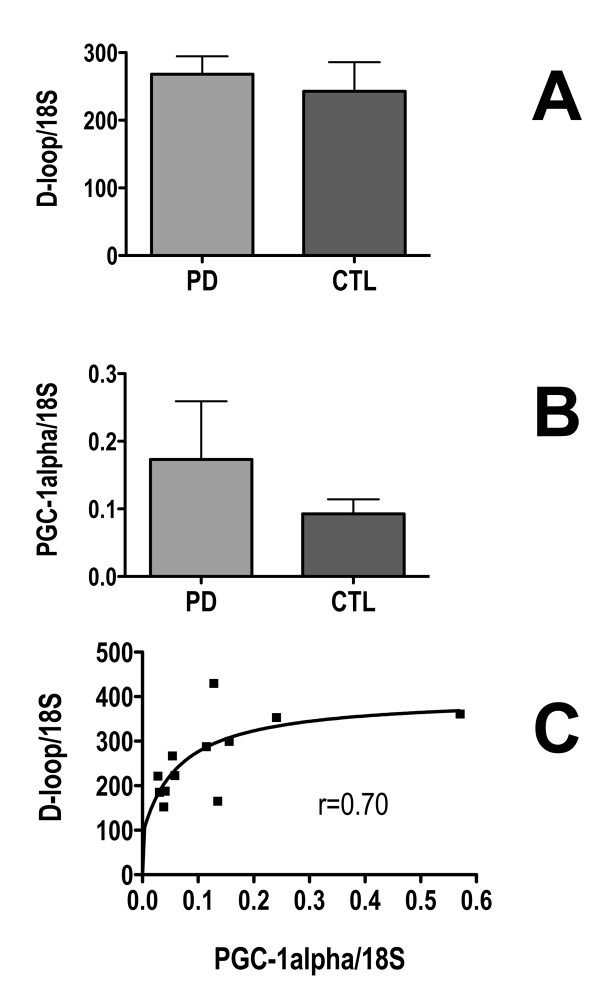
Figure 6.
Levels of mtDNA and PGC-1α expression in sPD and CTL brain homogenates. mtDNA D-loop was assayed with qPCR in genomic DNA's and PGC-1α expression was assayed with qPCR in cDNA's derived from sPD and CTL brain total homogenates and normalized to 18S rRNA levels. Their relationship was best described by a two-variable rectangular hyperbola shown in C.

