Figure 4.

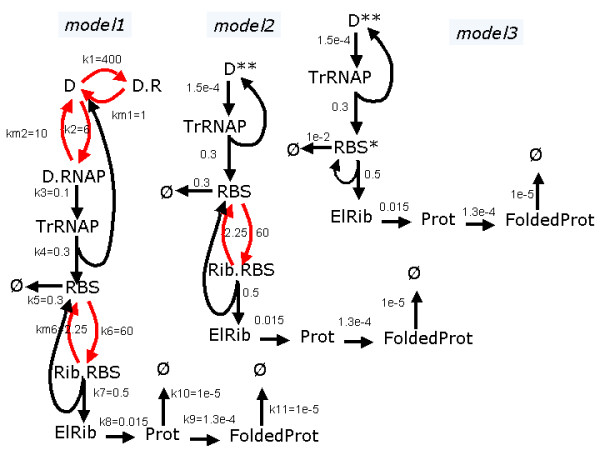
Repressed bacterium operon. The cycles to be averaged are in red. The numbers represent first order rate constants (including concentrations of buffered substrates where it is the case, here for R = 2500).

Repressed bacterium operon. The cycles to be averaged are in red. The numbers represent first order rate constants (including concentrations of buffered substrates where it is the case, here for R = 2500).