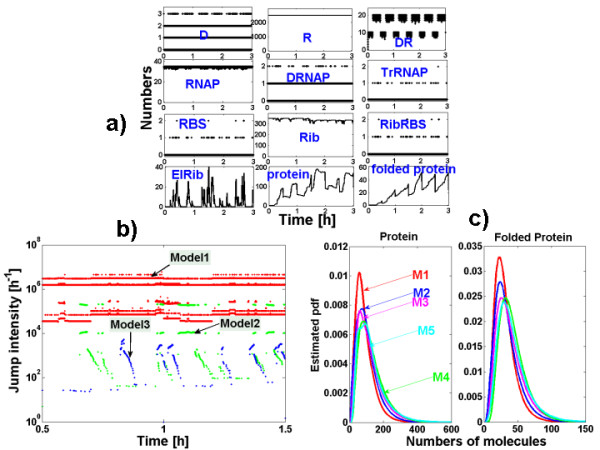
Figure 5.

Repressed bacterium operon. a) Trajectories for R = 2500. b) Jump intensities for three SSA versions of the repressed bacterium operon. Model 1 (without averaging), Model 2 (averaging of D, D.R, D.RN AP), Model 3 (averaging of D, D.R, D.RN AP, RBS, Rib.RBS). c) Steady probability distributions for the protein and folded protein obtained with the five versions of the model, for R = 2500. M3 and M4 are PDP obtained from M2 and M3, respectively.
