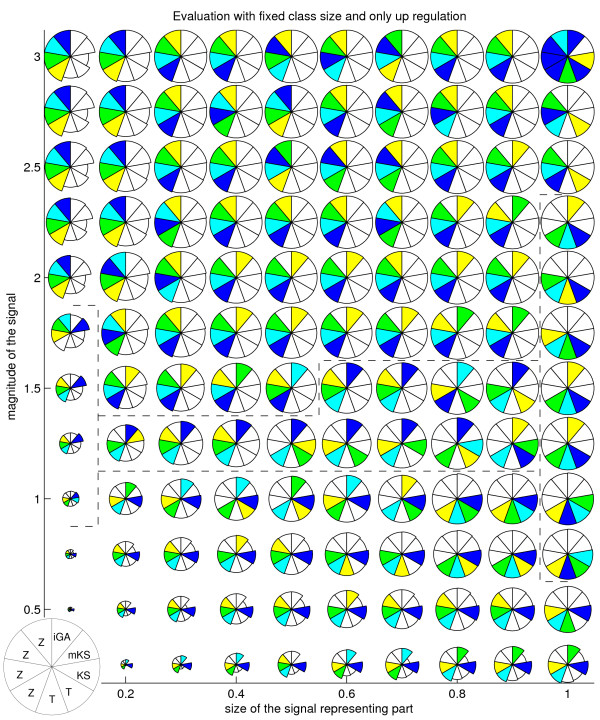
Figure 1.
Method performances for different artificial signals, when only up-regulation occurs. Method performances for each proportion of the signal representing part (Y axis) and signal magnitude (X axis) as measured by average AUC score. Score is shown by the radius of each sector. Methods represented are (starting from 11 o'clock, anticlockwise): 4 versions of GSZ-score, 2 versions of t-test, KS test, modKS test and iGA. Selected methods/parameters are shown in detail in table 1. Colouring (blue, cyan, green, yellow) highlights the four best methods, with equally well performing methods represented with the same colour. Dotted lines separate areas where different methods show the best performance. GSZ-score, selected to later analysis, is at 9 o'clock position.

