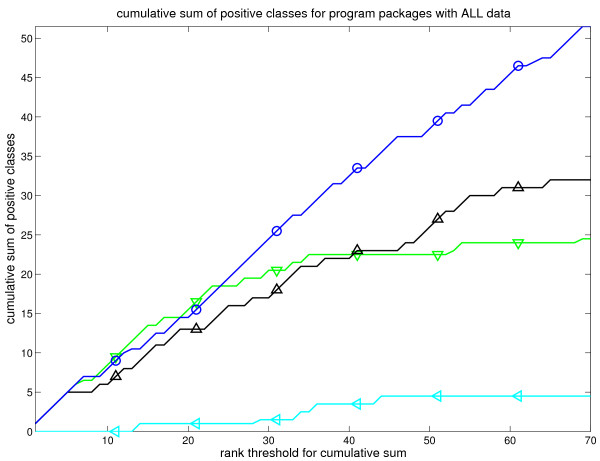
Figure 8.
Visualization of the cumulative sum of biologically positive classes among the top-70 classes for GSZ and compared programs. Figure shows how many biologically positive classes each method discovers across their top ranks. Blue line with circles denotes GSZ. Green line with triangle downwards denotes SP. Black line with triangle upwards denotes GSA. Cyan line with triangle to left denotes GSEA. Notice that although GSZ, GSA and SP first show equal performance, GSZ outperforms other methods across the later ranks. A more detailed view is provided in the supplementary table S5 [see additional file 11].

