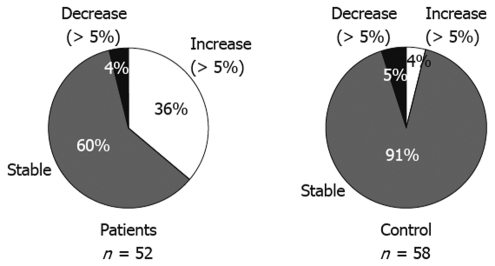
Figure 1.
Categorical change in body weight at the last visit compared to the baseline reading. Most of the control group (91%) remained stable, within a 5% change, compared to weight at the baseline. However, only 60% of the PPI group remained stable. In addition, compared with 4% of the control group, 36% of patients had a more than 5% increase above the baseline in body weight (P < 0.0001). n: Number of patients or control subjects.

