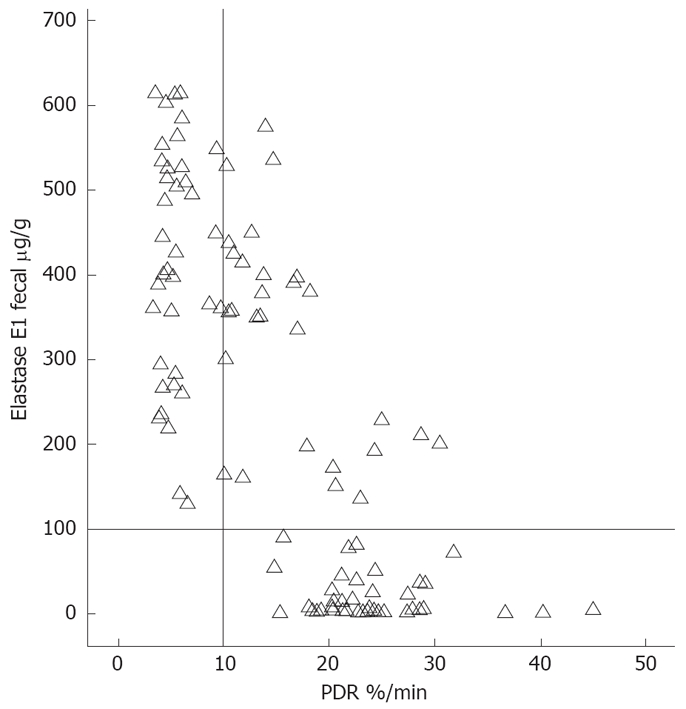
Figure 3.

An inverse correlation (r = -0.746, P < 0.001) between indocyanine clearance (PDR, %/min) and fecal E1 test (μg/g feces) in patients with ACP, ALC or ASA. Reference lines: PDR (%/min) = 15; E1 test = 100. Vertical line for PDR (%/min) = 10, and horizontal line for E1 test = 100 are marked in the figure.
