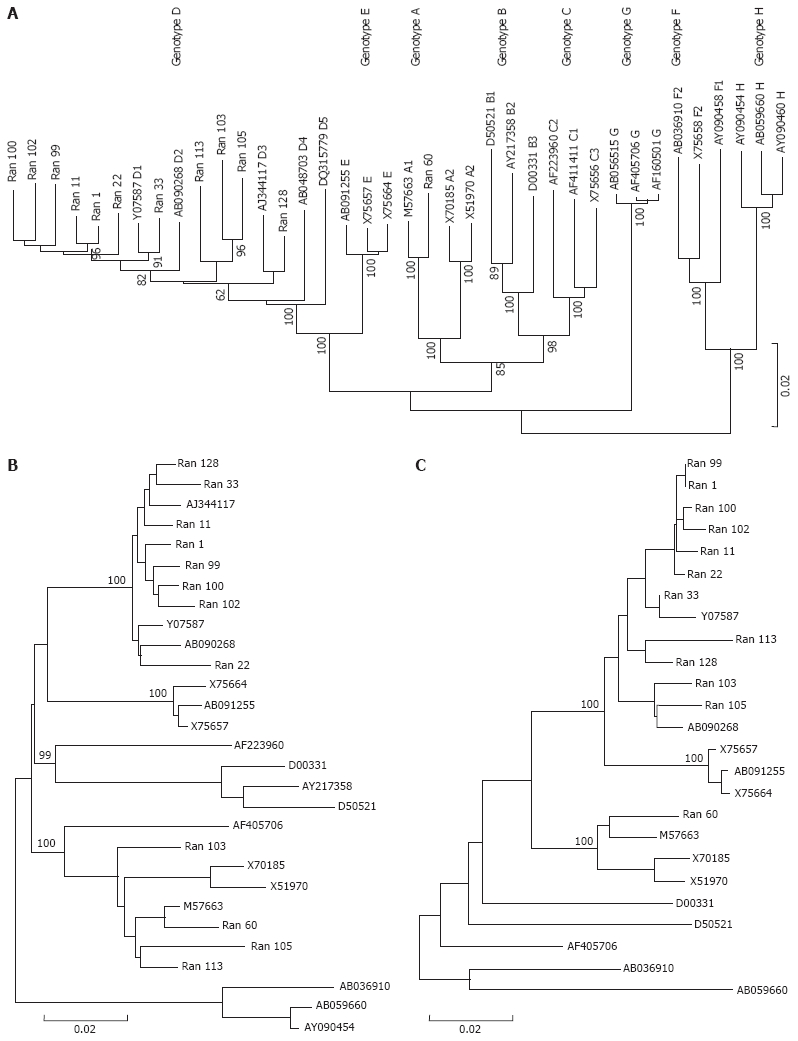
Figure 1.

Phylogenetic tree revealed the distribution of genotypes. A: Neighbor joining (NJ) phylogenetic tree was constructed based on the complete genome sequences of 26 HBV reference strains from DDBJ/EMBL/Genbank and 12 Indian HBV isolates in the present study. The bootstrap values obtained from 1000 replicas are shown at the nodes of the main branches. HBV strains from this study are marked as Ran as suffix followed by the isolate number. Reference sequences are denoted by their accession numbers. The capital letter A to H denotes the HBV genotype; B: Phylogenetic analysis done on the PreS2 and surface regions showing three additional (103,105,113) isolates to be grouped in genotype A branch. Phylogenetic trees were constructed by NJ Kimura two-parametric method. Bootstrap values are shown at the nodes of the main branch and at the bottom distance is given; C: Phylogenetic analysis using the Core region. Phylogenetic tree was constructed by NJ Kimura 2-parametric method Bootstrap values are shown at the nodes of the main branch and at the bottom distance given.
