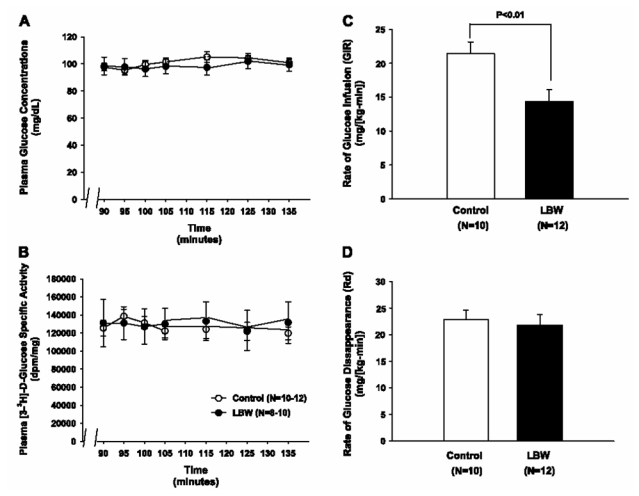
Fig. 1.

Insulin-stimulated glucose metabolism in 40-day-old control and low-birth-weight (LBW) rats. A: plasma glucose concentrations during the euglycemic hyperinsulinemic clamp. ○Controls; ●LBW. B: plasma [3-3H]glucose-specific activity during the euglycemic hyperinsulinemic clamp. ○Controls; ●LBW. C: rates of insulin-stimulated glucose infusion (GIR; n = 10–12). D: rates of glucose disappearance (Rd; n = 10–12).
