
Figure 3.
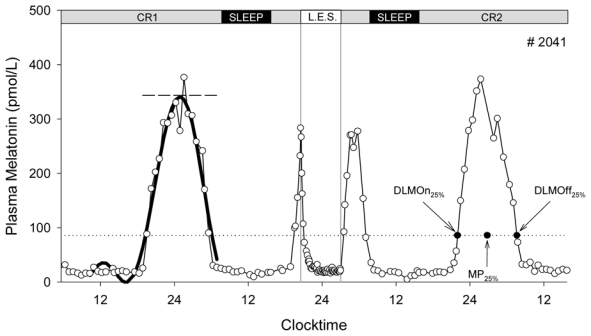
Method used for melatonin phase assessment using Dim Light Melatonin Onset (DLMOn25%), Dim Light Melatonin Offset (DLMOff25%) and midpoint (MP25%) phase markers. The thick line represents the three-harmonics fitted curve; the dashed line represents the amplitude of the fitted curve; the dotted line represents 25% of the amplitude. The figure also illustrates the bright light exposure session (L.E.S.)-induced melatonin suppression. The study days corresponding to the profile are given at the top of the figure. CR1: constant routine 1, CR2: constant routine 2.