
Figure 8.
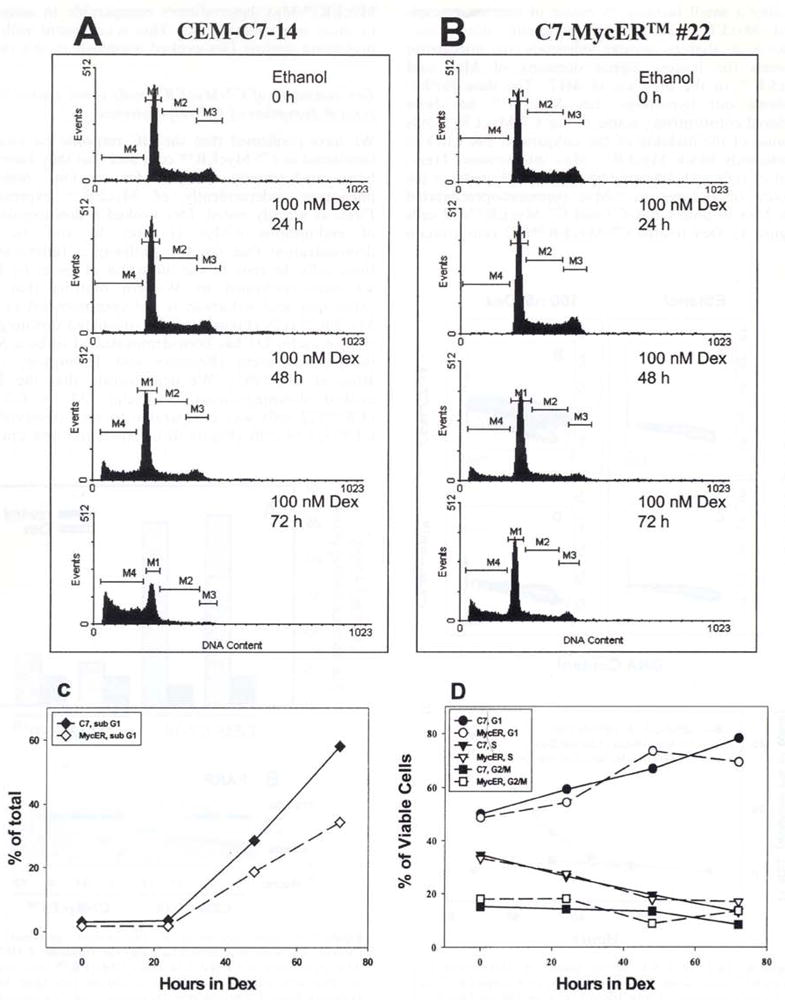
Flow cytometric analysis of Dex-mediated effects on cell cycle distribution. CEM-C7-14 and C7-MyeER™#22 cells were treated with ethanol vehicle or 100 nM Dex for the indicated times, harvested, and their DNA was stained with propidium iodide by sequential incubations in low salt and high salt solutions. The DNA content was measured flow cytometrically using the Cell Quest 1.2 software and a Becton Dickinson FACScan. (a) (CEM-C7-14) and (b) (C7-MycER™#22) show the distribution of 20000 singlet cells gated in individual windows based on their DNA content after treatment with 100 nM Dex for the indicated times. M1, M2, and M3 represent cells in G1, S and G2/M phases of the cell cycle. M4 corresponds to cells with a sub-G1 DNA content and are considered apoptotic. (c) depicts the time course of accumulation of cells with sub G1 DNA content in the presence of 100 nM Dex; data are plotted as a percentage of total cells analysed. In (d) Dex induced changes in distribution of non-apoptotic cells is measured as a function of the duration of Dex treatment. Cells in each phase of the cell cycle are represented as a percentage of viable cells (G1 + S + G2/M). Plots in a and b are from one representative of two independent experiments: data in c and d are averages of the two experiments