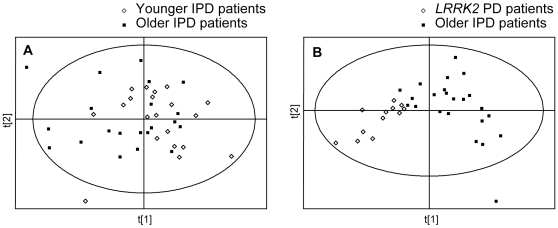
Figure 5. Age effects on metabolomic profiles of IPD patients and LRRK2 PD patients.
(A) PLS-DA scores plot showing lack of separation between younger (57.3±5.6 years old, n = 19, mean±SD) and older (71.4±3.3 years old, n = 22, mean±SD) idiopathic PD patients. (B) PLS-DA scores plot showing a significant separation between older idiopathic PD patients (71.4±3.3 years old, n = 22, mean±SD) and LRRK2 patients (72.8±11.2 years old, n = 12, mean±SD). The analytes discriminating between all IPD patients and LRRK2 patients (Figure 4 and Table 3) were used to for the analysis.

