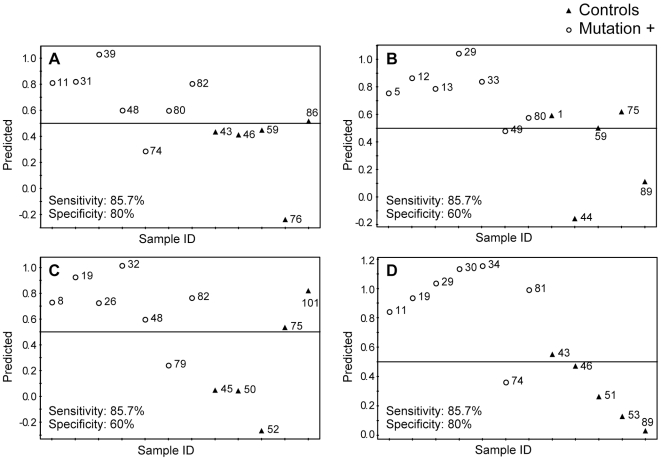
Figure 7. PLS-DA prediction plots of controls and subjects with G2019S LRRK2 gene mutation.
Nine analytes (Table 4) were used to build PLS-DA separation model, based on randomly selected 10 controls and 14 LRRK2 gene carriers (a representative plot is shown in Figure 6). The resulting models were used to predict class membership of the remaining 5 controls and 7 LRRK2 gene carriers. This procedure was carried out 4 times with different controls and gene carriers included in the test and training sets each time; the results are presented in panels A–D for all four individual models. Predictions were made with a cutoff of 0.5 for class membership. Numbers next to the symbols refer to the sample codes of the subjects.

