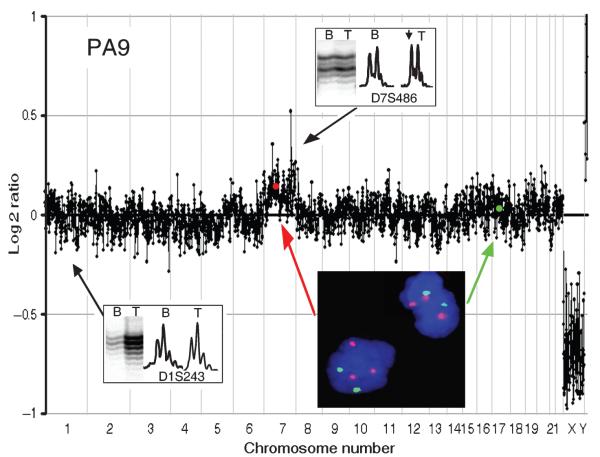
FIGURE 6.
A whole genome plot for PA9 showing a subtle gain of chromosome 7 confirmed by the gain of intensity of the tumor allele seen on the inset. A fluorescent in situ hybridization image of a section from PA9 is also shown. Chr7 centromeric probes are shown in red and Chr17 centromeric probes in green with a blue DAPI counterstain. Positions of centromeres of chromosomes 7 and 17 on the microarray comparative genomic hybridization plot are shown with a red and green dot, respectively. After immunohistochemical analysis with CD68k and CD45, this case had a revised estimate of tumor cell content of only 66%.

