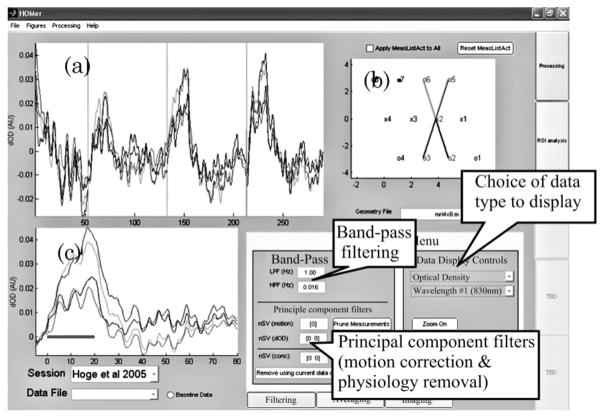
Fig. 7.
Screen shot of the HomER program. The layout of the HomER program is based around an interactive graphical display of the NIRS probe, shown in the upper right (b). The user specifies this probe geometry within the data file imported into HomER as described in the text. By selecting source (displayed as “x”) or detector (‘o”) positions on this probe layout, the user navigates through the display of their data. The original data are shown in (a) and the average evoked response is shown in (c). The data presented are described in [134] and were recorded during a 20 s finger-tapping task. Data shown are from a single run of one of the subjects.

