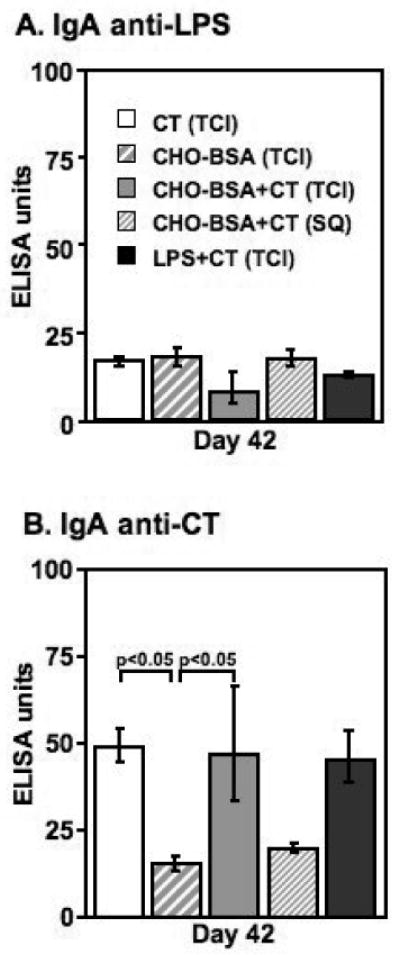
Figure 3.

Serum day 42 (A) anti-LPS IgA, and (B) anti-CT IgA responses in mice transcutaneously immunized (TCI) with CT, CHO-BSA, CHO-BSA and CT, or LPS and CT, or subcutaneously immunized (SQ) with CHO-BSA and CT. Geometric mean and standard error of the mean are reported for each group.
