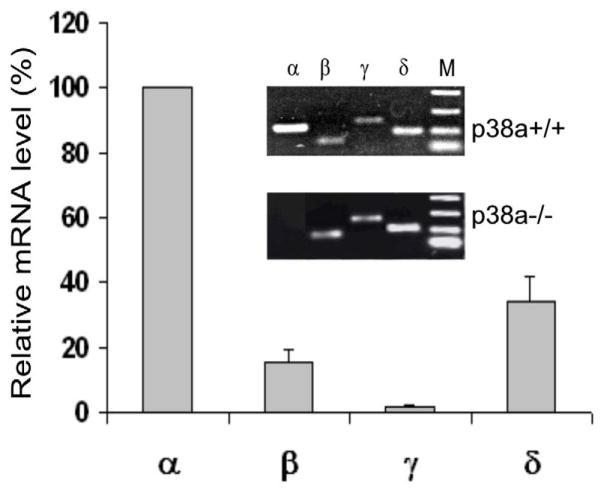
Fig. 1. Relative mRNA levels of p38 isoformsin p38 α+/+ and p38α−/− ESCs.
The graph represents the relative mRNA levels determined by RT-qPCR in p38α+/+ ESC. The mRNA levels of the four isoforms were first normalized to β-actin mRNA. The expression level of p38α was then set as 100 % for comparison. Results are means ± SEM of three independent experiments. The insets show the PCR products of the isoforms derived from p38α +/+ and p38α−/− ESCs analyzed by agarose gel electrophoresis. p38α is the most abundant isoform expressed in p38α+/+ ESCs, but it is completely eliminated in p38α−/− ESCs.

