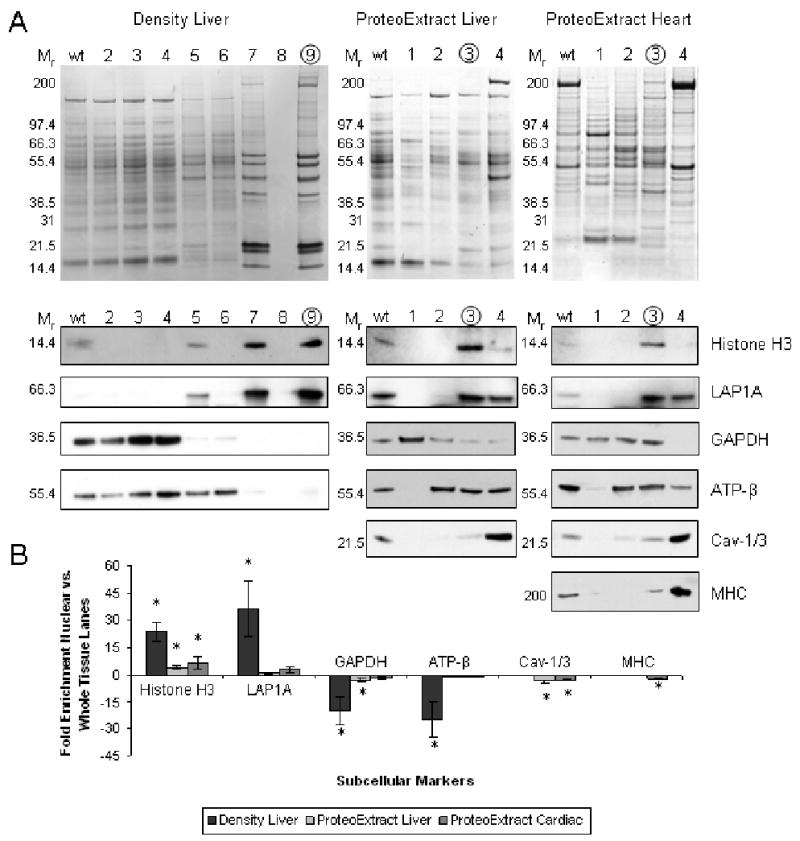
Figure 1. Western blot evaluation of density-based (liver) and ProteoExtract (liver and heart) fractionation.

Panel A shows representative 1D Coomassie stained gel of whole tissue (wt) and each of the steps during fractionation protocol (5 μg/lane). Proposed nuclear fractions are circled. Below are equivalent western blots indicating the relative distribution of various subcellular localization markers (1-10 μg/lane): H3 and LAP1A (nuclear), GAPDH (cytosolic), ATP-β (mitochondrial), Cav-1/3 (membrane) and MHC (myofilament). Panel B is the summary of average fold difference between western blot signals for wt and nuclear fraction (n=3). Error bars are ± one standard deviation and * = P<0.05. See Table S1 in online supplement.
