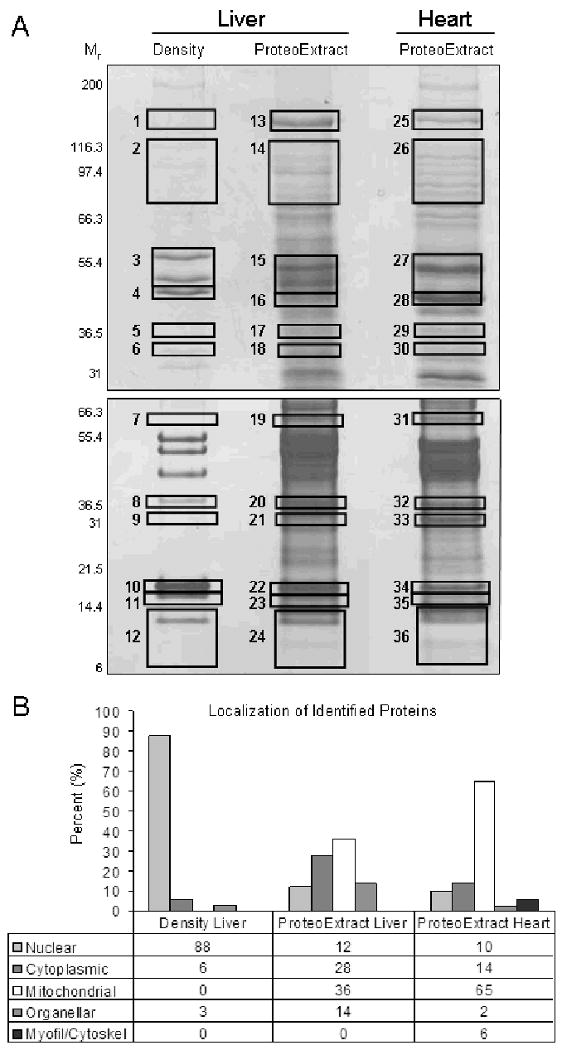
Figure 2. 1DE and LC/MS/MS analysis of density-based (liver) and ProteoExtract (liver and heart) derived nuclear extracts.

Panel A is the 1DE gel map, 100 μg of each nuclear extract was separated by an 8% (upper) and a 4-12% (lower) acrylamide gel (n=2). Boxes indicate gel bands/regions which were analyzed by LC/MS/MS, see Table S3 in online supplement for list of protein identifications per gel band. Panel B is a summary of the subcellular localization assignment for non-redundant proteins identified in each fractionation, see online supplement for details on subcellular assignment.
