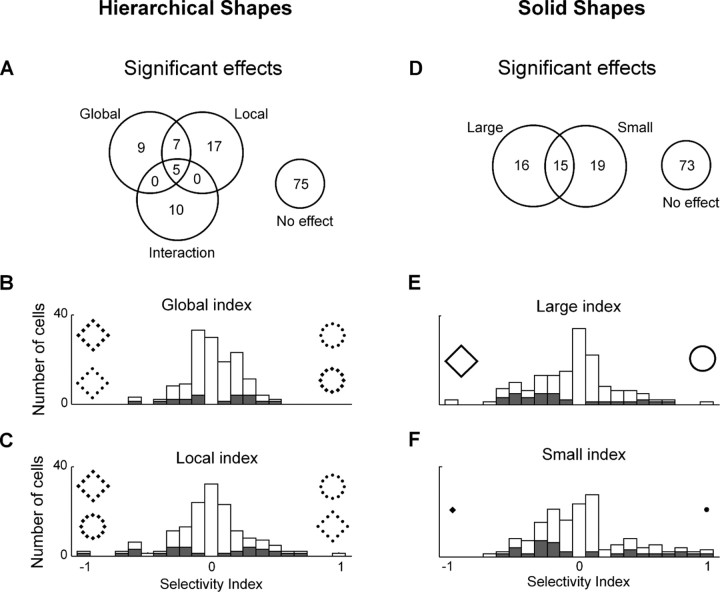
Figure 3.
IT neurons were selective for shape at the local and global level in hierarchical stimuli and for the shapes of large and small stimuli. A, Counts of statistically significant effects in an ANOVA with global shape and local shape as factors. B, Distribution of an index representing the strength of selectivity for global shape in hierarchical displays. C, Distribution of an index representing the strength of selectivity for local shape in hierarchical displays. D, Counts of statistically significant effects in an ANOVA, performed independently for large and small solid stimuli, with shape as the sole factor. E, Distribution of an index representing the strength of selectivity for the shape of a large solid stimulus. F, Distribution of an index representing the strength of selectivity for the shape of a small solid stimulus. B, C, E, and F are based on data from all 123 neurons. Shaded bars in each panel represent neurons in which the represented form of selectivity was statistically significant.

