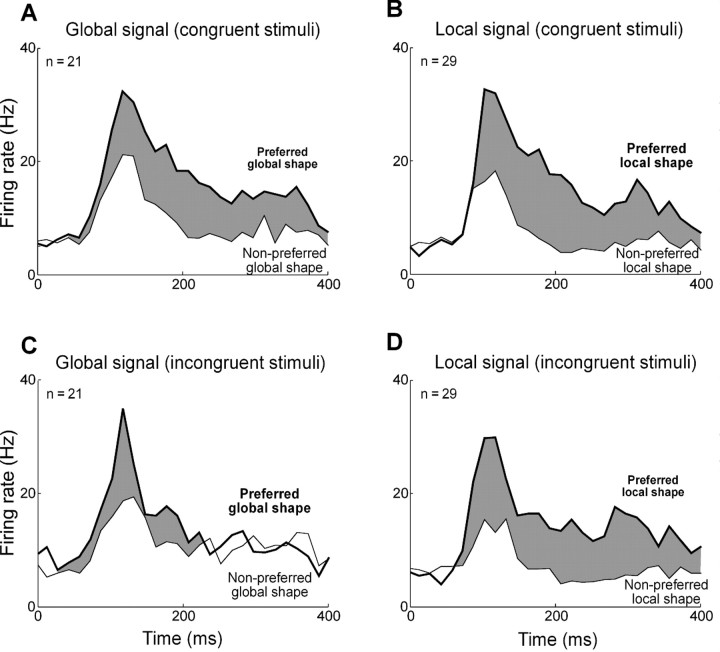
Figure 7.
Time course of population responses to congruent and incongruent hierarchical displays. A, Average response of 21 globally selective neurons to their preferred global shape (thick lines) and nonpreferred global shape (thin lines) for congruent displays. B, Corresponding plot for responses of 29 locally selective neurons. C, Average responses of 21 globally selective neurons to their preferred and nonpreferred global shapes for incongruent displays. D, Corresponding plot for 29 locally selective neurons. The width of the gray ribbon in each plot corresponds to the strength of the shape signal.

