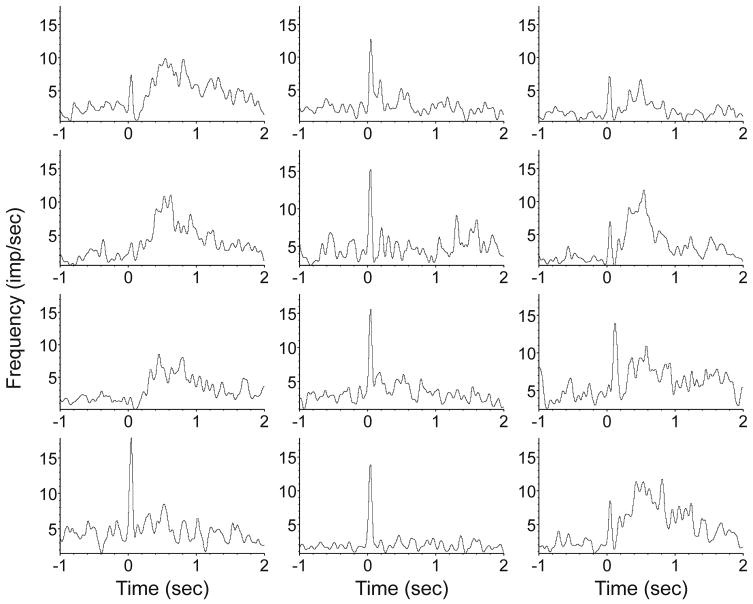
Figure 3.
Typical patterns of the visual cortex unit response to flash at 2% desflurane level. Time 0 marks the start of the flash stimulus. The early response (large peak at 40 ms) occurs in most units and most frequently is followed by a late response that can extend beyond 1 second. Some units display an early response component or a late component only. Each histogram represents an average of responses from 60 trials. Bin size is 10 ms, displayed values are after 5-point Gaussian smoothing. Ordinate units are in spikes/s.

