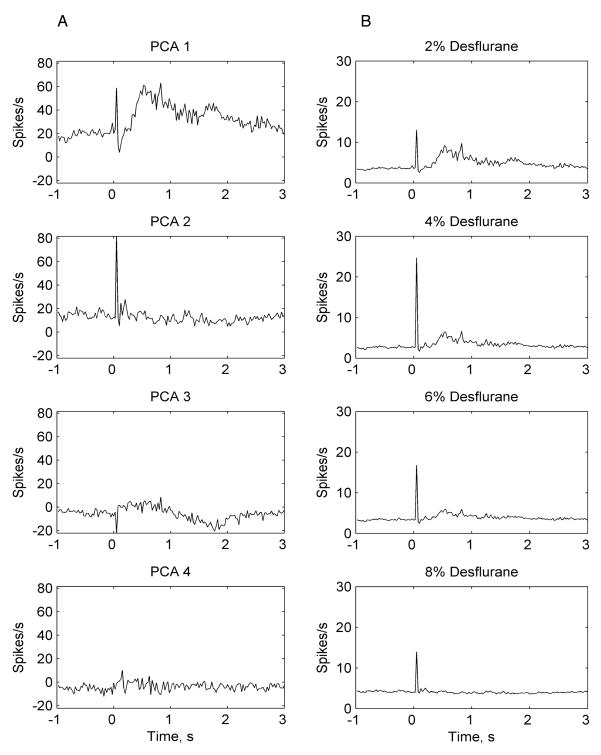
Figure 6.
Illustration of modeling the population response to flash using Principal Components Analysis and the General Linear Model in one experiment. Panel A shows the first four predicted peristimulus spike rate histograms (component scores) from the corresponding four principal components. Panel B shows spike rate responses at various anesthetic concentrations as modeled by the first two canonicals on Panel A. Although three principal components were significant, the first two components captured the responses of interest. Note the early + late response represented in the first principal component (PCA 1) and the early only response represented in the second principal component (PCA 2). A concentration-dependent suppression of the late population response by desflurane is evident from Panel B. The early response is not attenuated in the examined anesthetic range.

