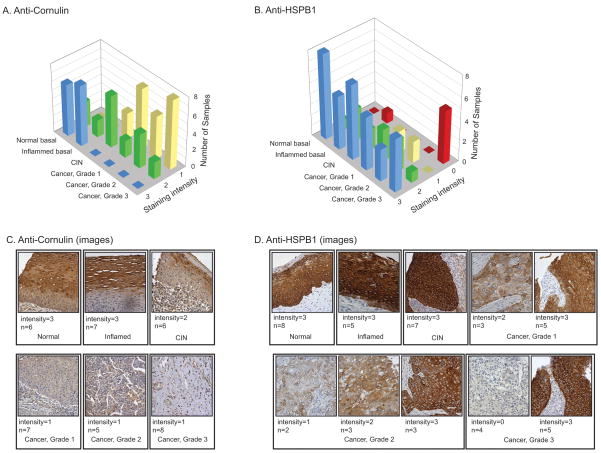
FIG. 5. Immunohistochemistry with tissue microarray.
Commercial microarray with samples drawn from an independent patient cohort. Scoring was as in Fig. 4. A, B, Histograms of staining intensity. C. Representative sections stained with anti-cornulin demonstrating intense staining in normal and inflamed tissue, moderate staining in CIN, and reduced staining in cancer. D. Representative sections stained with anti-HSPB1 demonstrating intense staining in normal, inflamed, and CIN, and large variance in cancer.

