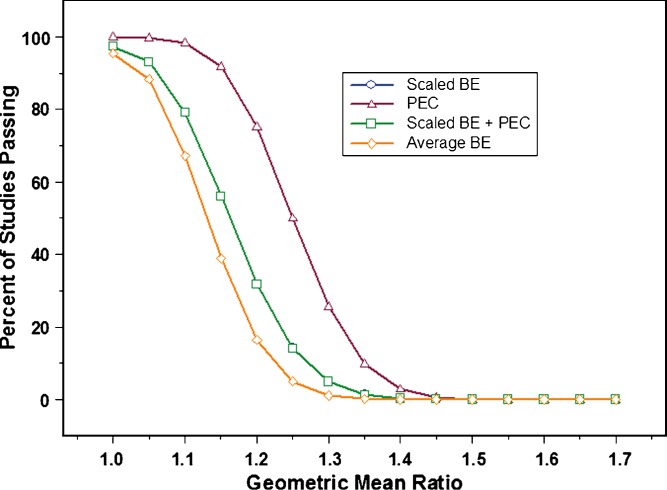
Fig. 3.
Power curves for average BE (open diamond); scaled average BE with point estimate constraint (PEC)(open square); PEC (open triangle); and scaled average BE without PEC (open circle). The experimental conditions were as follows: 30% CV (test and reference), N = 36, and σ w0 = 0.25. Results shown represent one million simulations. Please note that the plot for scaled average BE does not appear on the graph because it completely overlaps with the plot for scaled average BE with point estimate constraint, indicating no impact of constraining the point estimate at this level of within subject variability

