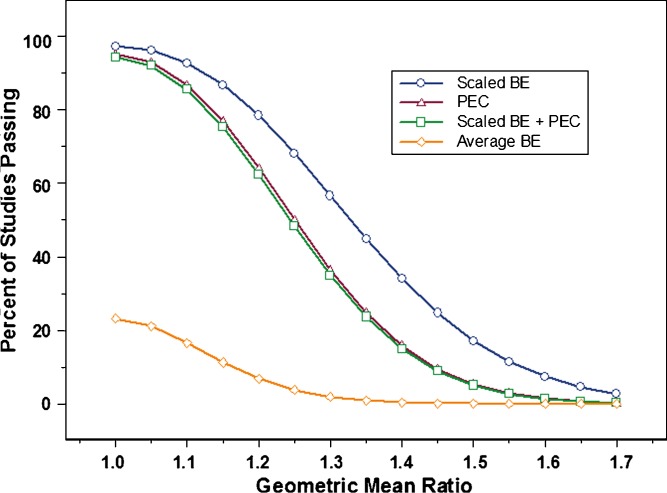
Fig. 4.
Power curves for average BE (open diamond); scaled average BE with PEC(open square); PEC (open triangle); and scaled average BE without PEC (open circle). The experimental conditions were as follows: 60% CV (test and reference), N = 36, and σ w0 = 0.25. Results shown represent one million simulations

