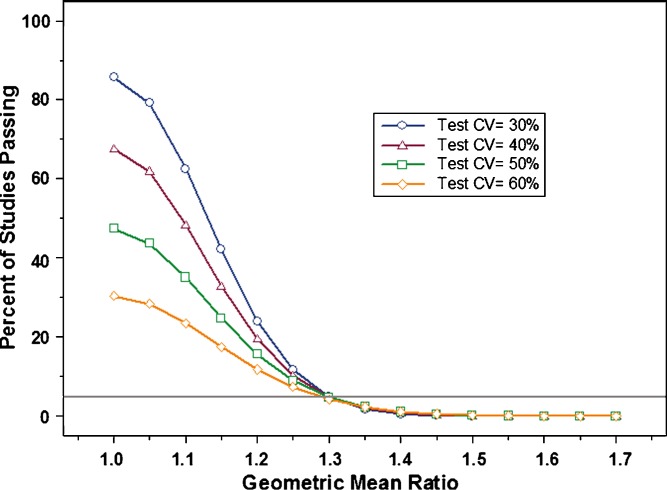
Fig. 6.
This graph illustrates the impact on study power of increasing within subject variability in the test product, while keeping variability of the reference constant (30% CV). Variability (%CV) in the test product evaluated was: 30% (open circle), 40% (open triangle), 50% (open square), 60% (open diamond)

