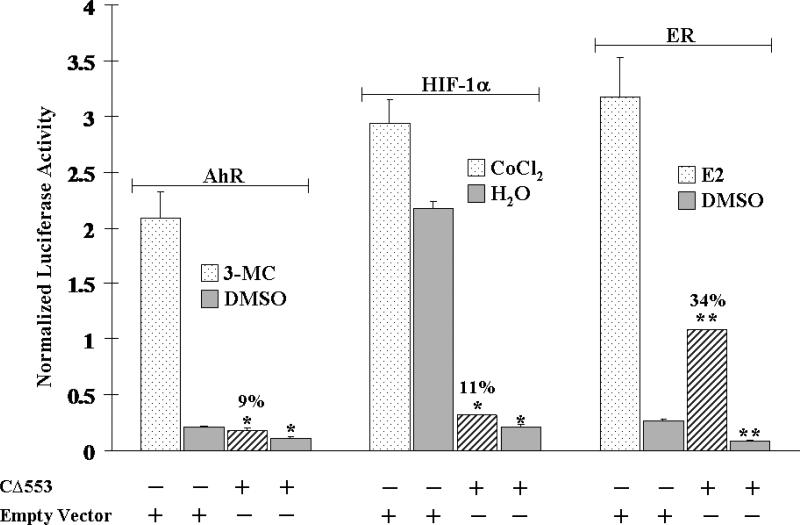
Figure 3.
CΔ553 inhibited the DRE- (left), HRE- (middle), and ERE- (right) driven luciferase expression +/− the corresponding inducer 1 μM 3-MC, 100 μM CoCl2 and 10 nM E2 in MCF-7 cells. 0.8 μg of DNA (0.18 μg reporter plasmid (pGudLuc1.1, pGL3-Epo, or pERE-Luc) plus 0.02 μg of pCH110 plus 0.6 μg of pCMV-CΔ553 or empty vector pCMV-Tag4A) per 1.5 μl of lipofectamine 2000. Y-axis represents luciferase activity normalized by the β-galactosidase activity. Double asterisk shows a significant difference (p < 0.005) when compared to the corresponding empty vector control. Error bars represent the standard deviation of the means in triplicate (n=3, mean ± SD).

