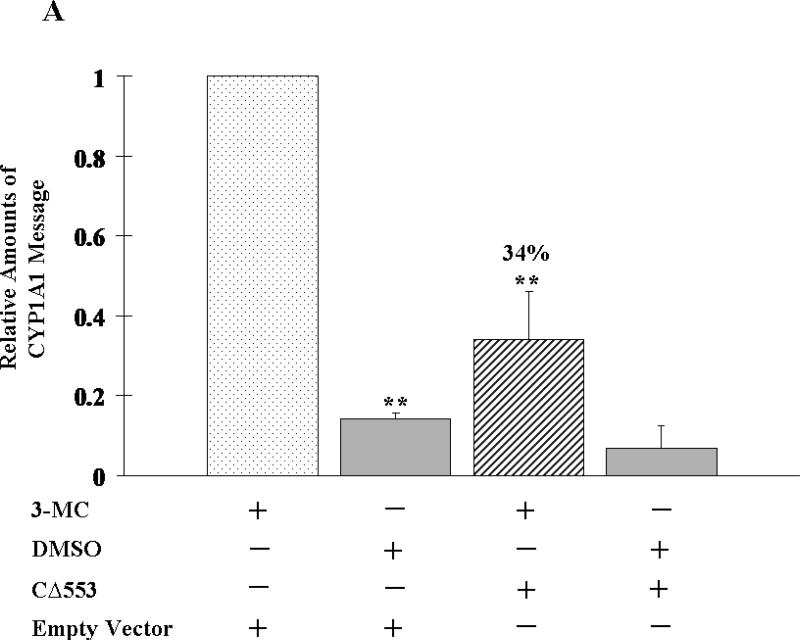
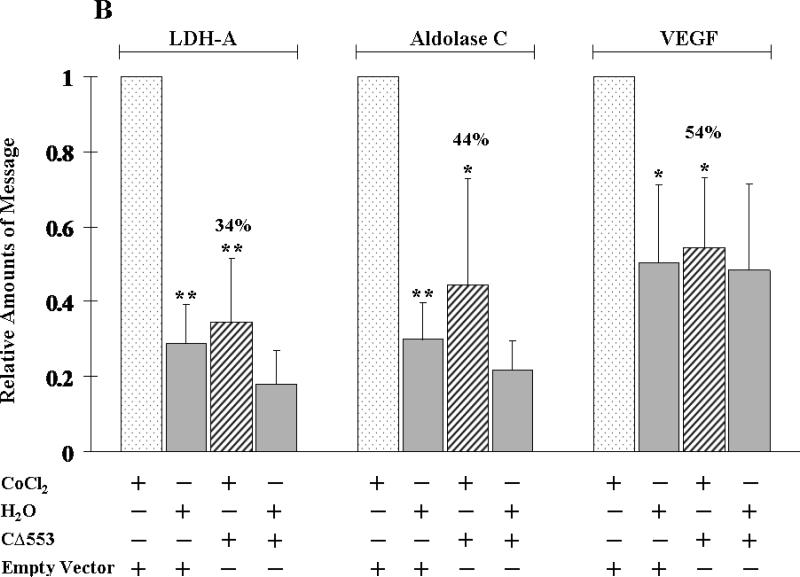
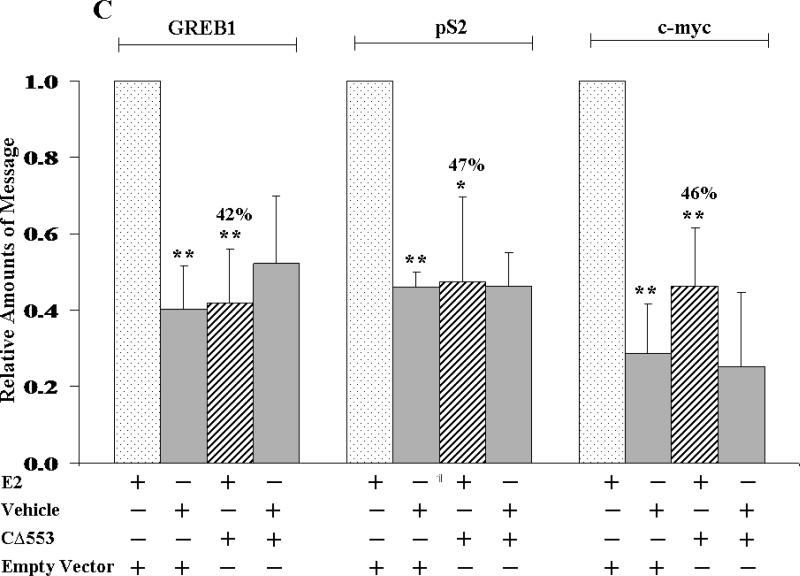
Figure 5.
Effect of CΔ553 on up-regulation of target gene expression in MCF-7 cells. A, 1 μM 3-MC or DMSO for 6 hours; B, 100 μM CoCl2 or water for 6 hours and C, 10 nM E2 or ethanol/DMSO (4:1) for 18 hours. Each condition (well) contained 4 μg of pCMV-CΔ553 or empty vector pCMV-Tag4A per 7.5 μl of Lipofectamine 2000. RT/real-time QPCR results showing the amount of messages from various conditions normalized to the amount of messages in the standard (minus CΔ553 plus inducer) which is arbitrarily set to one in all cases (first left column in each panel). Y-axis represents the normalized fold increase using the 2−ΔΔCT method. Error bars represent the standard deviation of the means in triplicate (n=3, mean ± SD).


