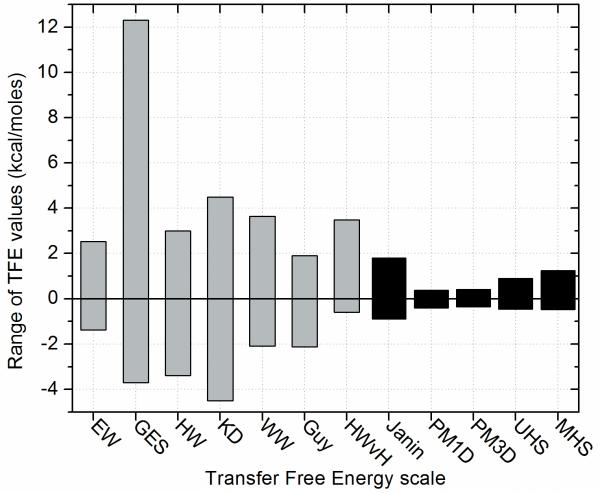
Figure (1).
The diagram shows the range of transfer free energy values in kcal/moles for the different scales (EW: Eisenberg & Weiss; GES: Goldman, Engelman, Steitz; HW: Hopp & Woods; KD: Kyte & Doolittle; WW: Wimley & White; HWvH: Hessa, White & von Heijne; PM: Punta & Maritan; UHS: Unified Hydrophobicity Scales derived here; MHS: Mammalian Hydrophobicity Scale derived here). Note, that the last five scales are knowledge-based scales and cover a much smaller range of values than any of the other scales.

