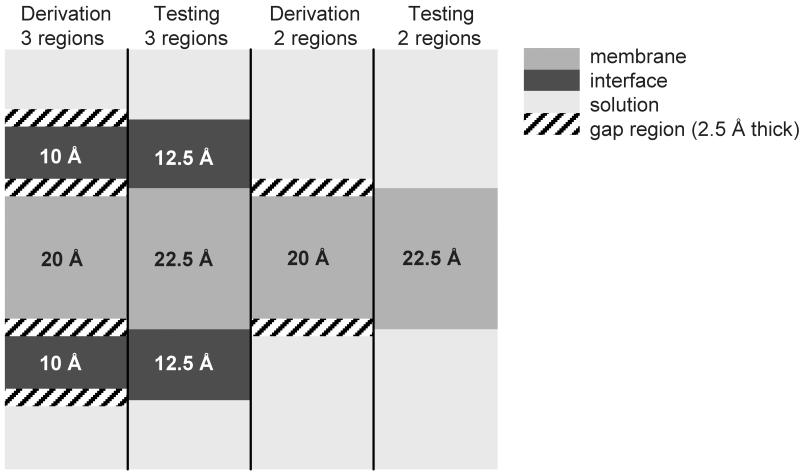
Figure (2).
Definition of the different regions for the derivation and the testing of the scale in the two- state- and three-state scenario. Thicknesses are indicated in black and white. The gap region of 2.5 Å thickness was introduced to more cleanly distinguish between the different regions. For the derivation the thicknesses were assumed as below. For the calculation of the agreements the derived scale was used for the prediction of TM spans from the sequence only and the prediction on a per-residue basis was compared to the ‘actual’ locations of the regions (see testing as in the figure). In the two-state scenario the interface region was added to the SOL because its characteristics are more similar to the soluble phase (due to the polar headgroups of the lipid molecules) than to the membrane interior.

