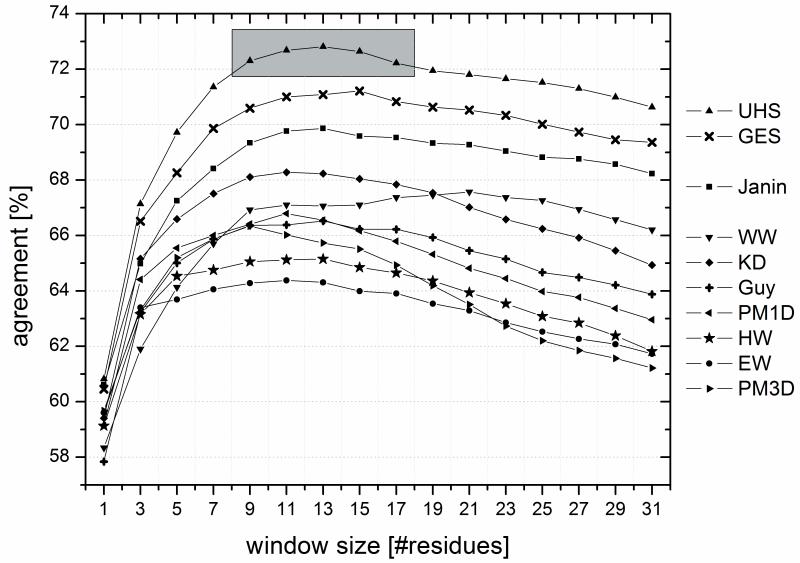
Figure (4).
For predicting trans-membrane spans from the sequence, the hydrophobicity values have to be averaged over a certain number of residues (“window”). The percent per-amino acid agreements between prediction and known location of the residues were computed as a function of window size for the scales from the literature (EW: Eisenberg & Weiss 17, GES: Goldman, Engelman, Steitz 2, HW: Hopp & Woods 1, KD: Kyte & Doolittle 10, WW: Wimley & White 5, Guy: Guy 18, Janin: Janin 7, PM1D and PM3D: Punta & Maritan 8) and for the Unified Hydrophobicity Scale (UHS). The shaded region indicates a range of window lengths for the UHS, which all yield similarly good performance. The best performance is seen for the UHS scale and the scale from GES.

