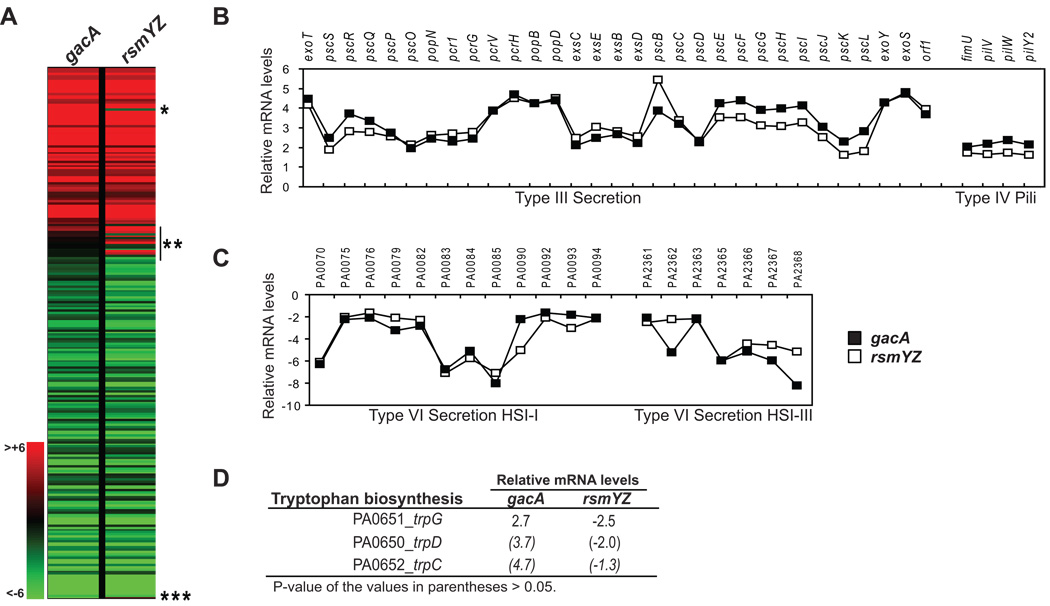
Figure 3. Comparison of mRNA levels relative to wild type between P. aeruginosa gacA and rsmYZ mutants.
A. Heatmap of the 241 genes whose mRNA levels changed more than two fold relative to wild type in at least one of the two mutants (See text and Table S1 for detail). Red color represents genes that were upregulated relative to wild type, green represents genes that were downregulated relative to wild type (see color scale on the left). * trpC gene, which was upregulated in the gacA strain but was not affected in the rsmYZ strain (See text for detail); ** genes whose expression was affected in the rsmYZ strain only (See text and Table S3 for detail); *** gacA gene; downregulation in the gacA strain is artificial as this gene was deleted in this strain.
B–D. mRNA levels of selected genes in the gacA and rsmYZ mutants relative to wild type. B. Type III secretion genes and Type IV pili genes were upregulated in both gacA and rsmYZ mutants. C. Genes encoded in the Type VI secretion islands HSI-I and HSI-III were downregulated in both gacA and rsmYZ mutants. Open symbols – gacA mutant; Closed symbols – rsmYZ mutant. D. Genes encoded in the trp operon were upregulated in the gacA mutant and downregulated in the rsmYZ mutant (See text for detail).

