Figure 3.
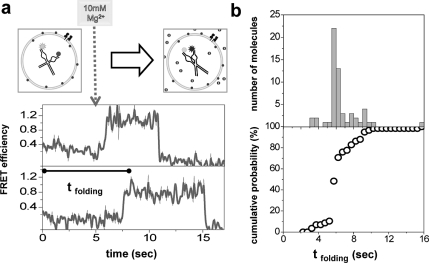
(a) At t = 0, ribozymes encapsulated in porous SUVs are subject to no Mg2+, hence stay unfolded (low FRET). Upon injection of 10 mM Mg2+ into the sample chamber (between fifth and sixth seconds after data acquisition, marked with a dashed arrow), ribozymes rapidly fold (transition to high FRET). The duration for the FRET value to reach ∼0.8 from t = 0 is defined as time of folding (tfolding). The top and the bottom graphs belong to different SUVs (hence different ribozymes) from the same run (thin, black line: raw data; thick, gray line: B-spline smoothed data). (b) Histogram for times of folding (top) and corresponding percentile cumulative folding probability vs time (bottom) obtained from individual traces.

