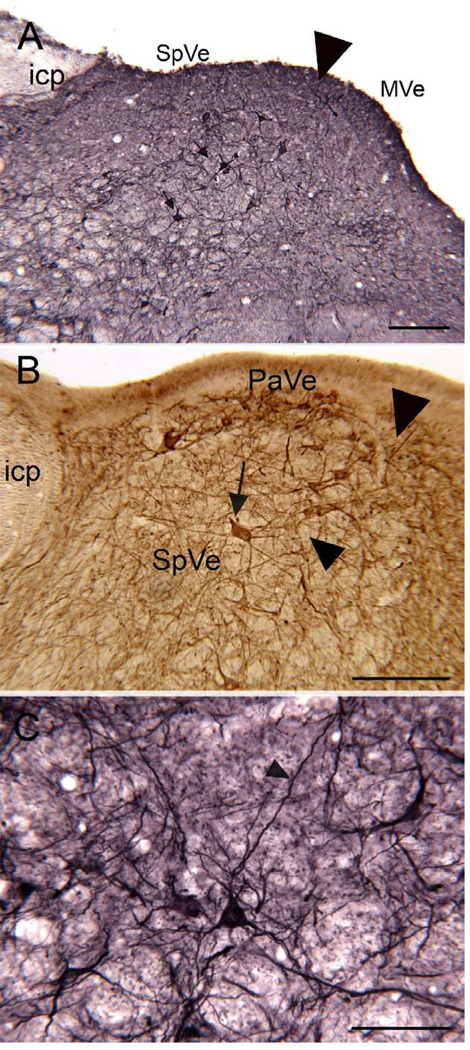
Figure 1.
SpVe. A. The arrowhead indicates the border between the MVe and the SpVe. The SpVe is crossed by stained processes running in all directions, and there are scattered large labeled cells (arrows). DAB-GO visualization. Scale bar 250 µm. icp, inferior cerebellar peduncle. B. Section through the SpVe at the level of the paravestibular nucleus, PaVe. Arrow s a large stained cell; arrowhead on the left indicates the locus of unstained fibers. The arrowhead on the right indicates the border with the MVe. DAB visualization. Scale bar 250 µm. C. Higher magnification image of a labeled cell in the SpVe with a pyramidal-shaped cell-body. DAB-GO. Scale bar 100 µm.

