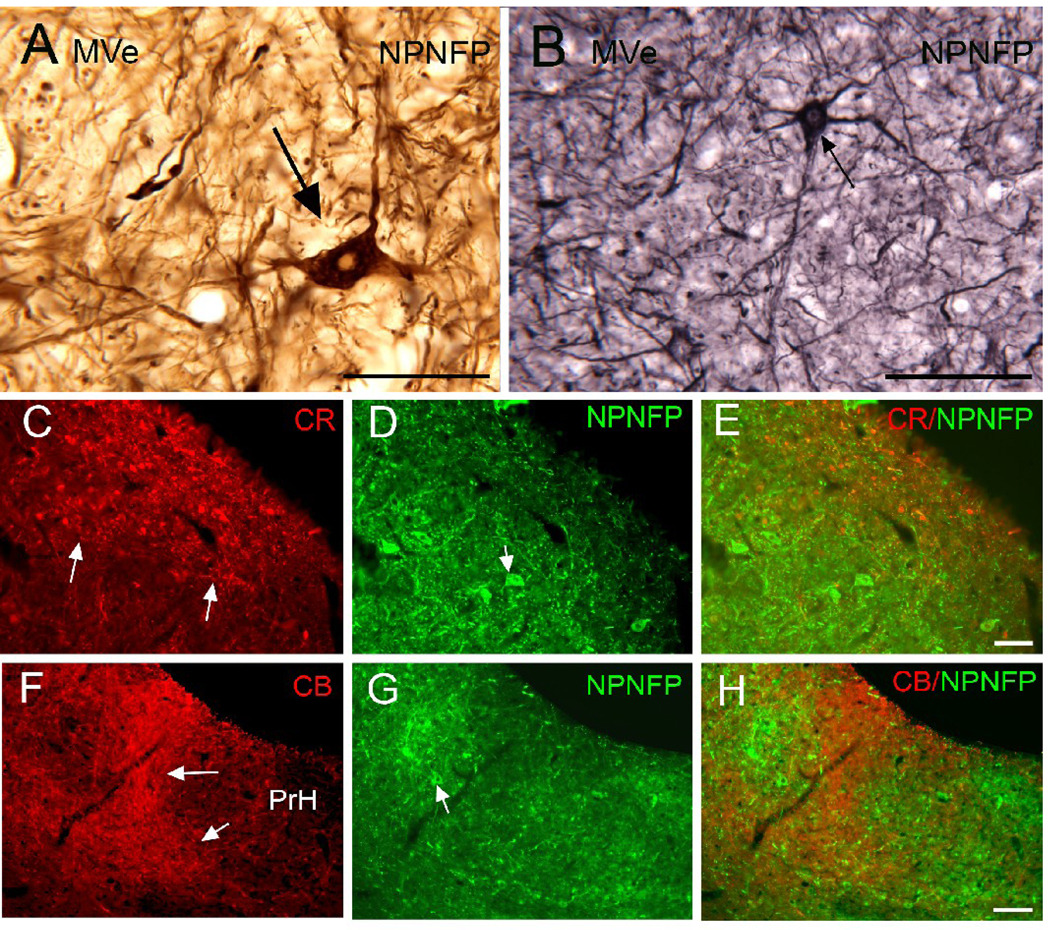
Figure 2.
MVe. A. Very large NPNFP-labeled cell, arrow, with a polygonal cell body. Note the clear nucleus. DAB. Scale bar 100 µm. B. Arrow shows a labeled cell with multiple stained dendrites and a pear-shaped soma. DAB-GO. Scale bar 100 µm. C, D, E. Comparison of the distribution of CR (C; arrows show the area of intense CR expression) and NPNFP (D) immunoreactivity. E. The merged image shows spatial separation of the two populations. Scale bar (C, D, E) 100 µm. F, G, H. Comparison of the distribution of CB and NPNFP immunoreactivity. F. The two arrows show the medial border of the region of intense CB immunoreactivty. G. The arrow shows an NPNFP cell H. The merged image shows that the NPNFP cell is lateral to the CB region. Scale bar (F,G,H) 100 µm.

