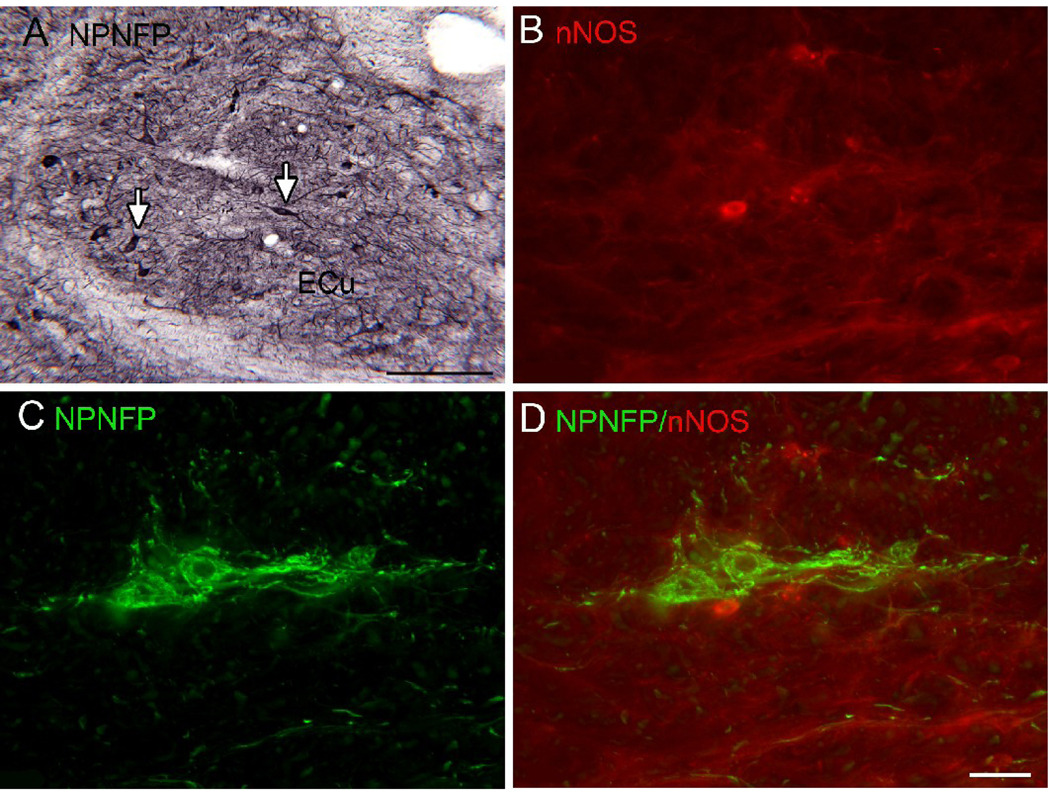
Figure 6.
A. Scattered cells and dendrites in the ECu express NPNFP; the arrows show examples of labeled cells with polygonal (left) and spindle-shaped somas (right). DAB-GO. Scale bar 250 µm. B. nNOS-ir cell in ECu. C. NPNFP label in cells in the ECu. D. The merged image shows expression of nNOS and NPNFP in different cells in the ECu .Scale bar 100 µm (B,C,D).

