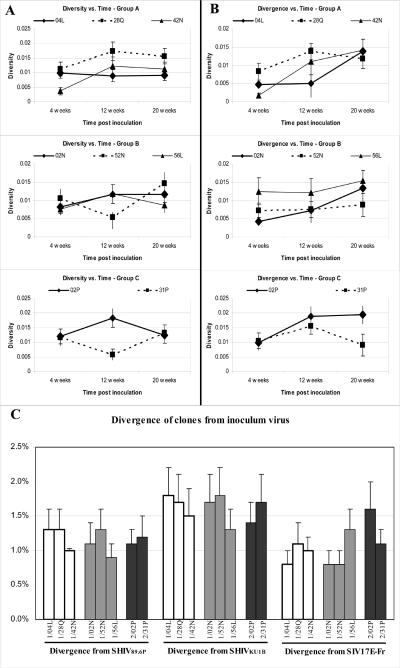
Figure 2.
For each animal, all the sequenced clones for one time point (4, 12 or 20 weeks) were aligned (BioEdit) and a distance matrix was calculated (Mega, 3.0). The means of these distances for each time is plotted versus time for Group A − Morphine + Fast Progressors , Group B − Morphine + Normal Progressors, and Group C − Non-morphine + Normal Progressors in the top, middle and lower panels, respectively. A The overall diversity among all clones, not including the inoculum, is plotted against time post inoculation. B The average divergence of all clones from the SIV17E-Fr inoculum virus is graphed versus time. C The total divergence from each of the three infecting virus for all times points of the clones is plotted. Group A animals are graphed with solid white bars, Group B with gray bars and Group C with black bars. Individual animals and the inoculum virus used for divergence measurements are indicated below each bar.

