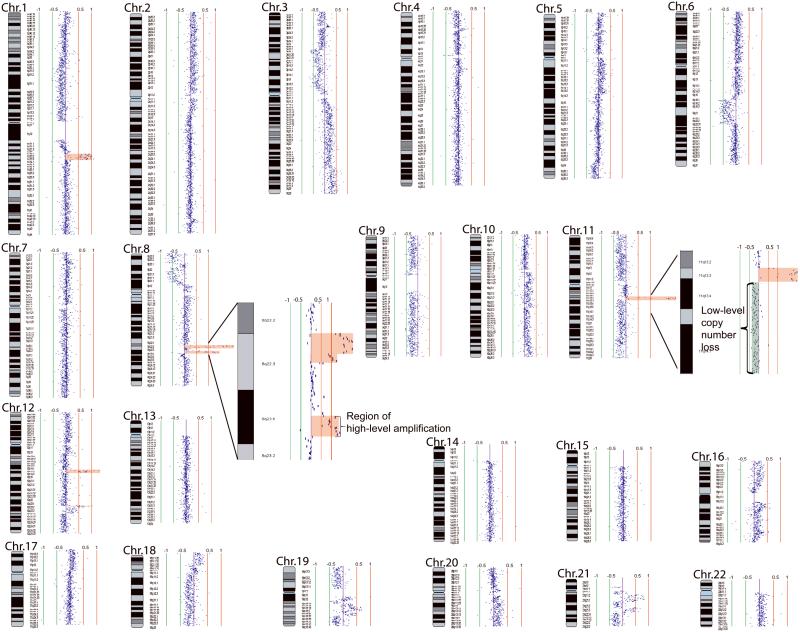
Figure 1.
Whole genome tiling-path array profile of a carcinoma in situ (CIS) Oral42. Each data point represents one BAC-derived segment on the array. The log2 signal intensity ratios of a competitive hybridization with pooled male genomic DNA are plotted by SeeGH software.34 The red and green bar lines are positive and negative log2 signal intensity ratio lines scaled by an increment of 0.5. Data points to the left and right of the centre line represent DNA copy number losses and gains, respectively. Specifically, seven regions of gene amplification on 1q23.2-q23.3, 1q23.3-q24.1, 8q22.2-q22.3, 8q23.1, 11q13.3-q13.4, 12q14.3, and 12q23.2-q23.3 are shaded red. Magnified views of the two amplicons on chromosome 8, and a region of low-level copy number loss and a region of gene amplification on chromosome 11 are shown in two insets.

