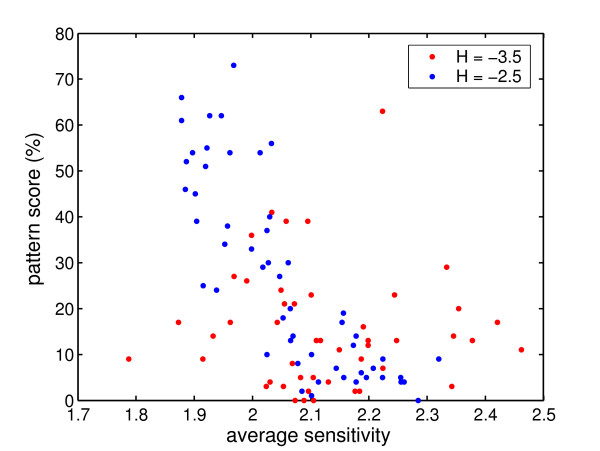
Figure 10.
Scatter plot of pattern scores versus average circuit sensitivity. On the x-axis, average sensitivity of a circuit is plotted and on the y-axis the overall pattern score as percentage, which was obtained from 100 stochastic simulation runs. This figure shows that sensitive circuits are not robust towards fluctuations.

