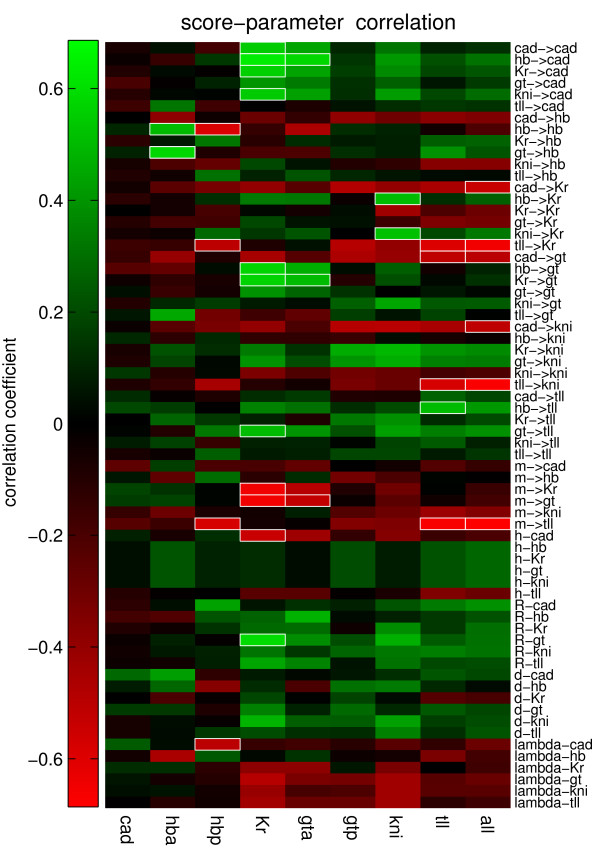
Figure 5.
Correlation between the score of the eight different expression domains obtained from stochastic simulations and all parameters. Bright green represents a strong positive correlation and bright red a strong negative correlation. Squares in white borders are the most significant correlations.

