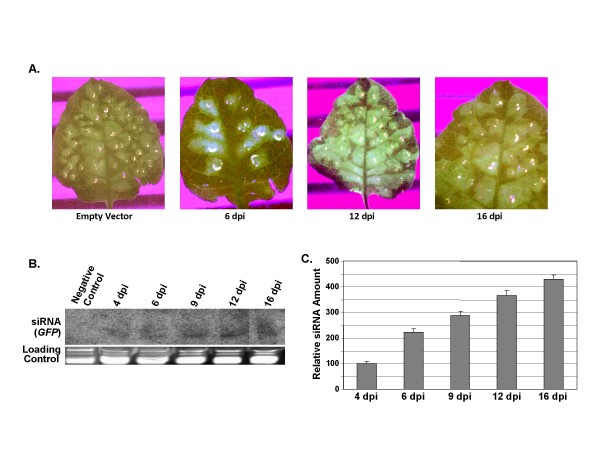
Figure 4.
GFP expression and subsequent siRNA accumulation in tobacco plants as a function of time. Leaves of tobacco plants infiltrated with full-length GFP gene cloned in VA/pCAMBIA1391Z (referred to as VIGS-GFP) and with VA/pCAMBIA1391Z (empty vector) were photographed under UV illumination to monitor the expression of GFP at indicated dpi. (B) Autoradiograph showing the formation of siRNAs probed with radiolabeled GFP gene. (C) The relative intensities of the siRNA bands were estimated and the normalized values with respect to corresponding loading controls are plotted as a bar graph. The value at 4 dpi was arbitrarily assigned as 100%. The standard deviations shown are based on three independent experiments.

