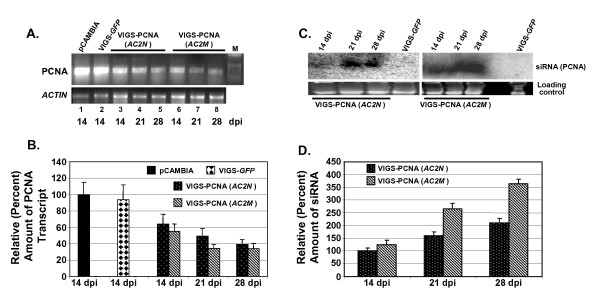
Figure 7.
Mutation of silencing suppressor AC2 leads to increased silencing of PCNA. (A) The transcript levels of PCNA gene in the agroinfiltrated leaves of tomato plants at various dpi as indicated were estimated through RT-PCR. ACTIN gene was used as an internal control. (B) The band intensities were normalized with respect to corresponding controls (ACTIN) and are plotted as bar graphs. (C) Autoradiogram showing the levels of siRNAs present in these samples checked by Northern hybridization using PCNA as the probe. (D) The relative intensities of the bands were estimated and the normalized values with respect to corresponding loading controls are plotted as a bar graph. Assignment of the values of 100% in all these panels was arbitrary. The standard deviations shown in the bar graphs (panels B and D) are based on three independent experiments.

