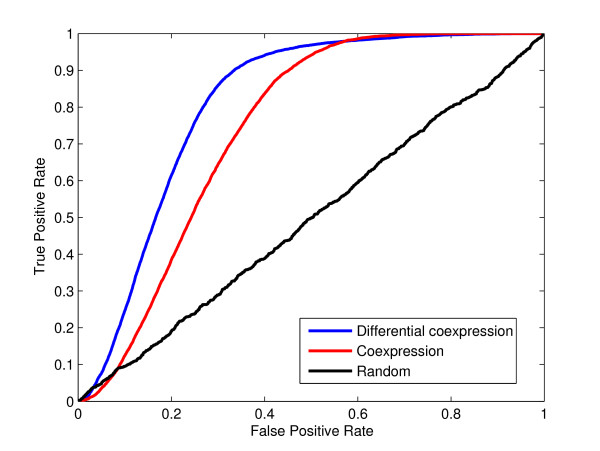
Figure 5.
Functional categories of genes can be predicted by differential coexpression. The blue line curve shows the result of leave one out validation to generate an ROC curve for reconstructing GO categories containing 10-30 genes using their differential coexpression values with AUC 0.81. The red line shows if coexpression values alone are used (0.74). The black line curve shows the resulting ROC curve if in place of GO sets, random sets with 10-30 genes are used (AUC 0.49).

