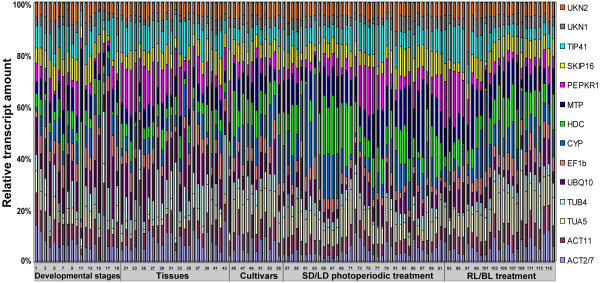
Figure 2.
Distribution of relative transcript quantities of the reference genes across all samples. Transcript quantities are represented as percentages of the aggregated 14-transcript pool for each sample. 1-20: across various developmental stages; 21-44: across different tissues; 45-56: across cultivars; 57-92: response to short day (SD) and long day (LD) photoperiods; 93-116: response to exposure to red (RL) and blue (BL) light. Detailed sample information given in Additional file 5.

