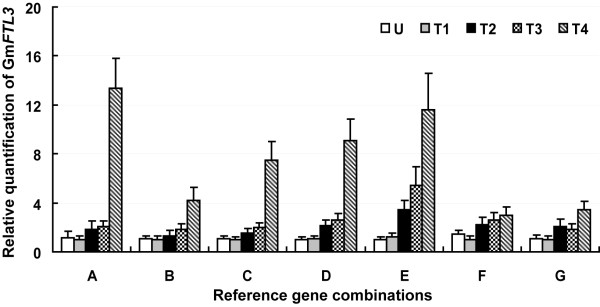
Figure 4.
Relative quantification of GmFTL3 expression using validated reference genes for normalization. A: SKIP16; B: UKN1; C: SKIP16 and UKN1; D: SKIP16, UKN1 and MTP; E: SKIP16, UKN1, MTP and EF1b; F: CYP; G: TUB4. The results are represented as a mean fold change in relative expression compared to the first sampling stage (U). cDNA samples taken from the same set used for gene expression stability analysis: U, T1, T2, T3 and T4 indicate, respectively, the aerial part of plants collected at the full expansion of the unifoliolate, the first trifoliolate, the second trifoliolate, the third trifoliolate and the fourth trifoliolate leaf.

